- Русский
- English
- Português
Descending Wedge in Cryptocurrency Trading: How to Properly Identify and Trade the Breakout

about cryptocurrencies.
Breakout Trading not only acts as a trading strategy or system but includes the whole process of explaining how you view price movements in the market. A key element in how to create your own personal definition is by developing an ability to see, recognize, and interpret the signals of the falling wedge pattern, in addition to other price action formations that traders utilize to develop an expectation for market movements.
This is what we do at ASCN.AI, and our goal is to produce clearer pictures for traders by providing unique data and analysis using Artificial Intelligence (AI).
Defining the "Wedge" Pattern
The wedge is an important chart pattern within technical analysis, representing two converging trendlines, creating a range of prices created by utilizing two converging trendlines, known as a "tightening" and "expanding" price structure, with a price range constrained between these two converging trendlines.
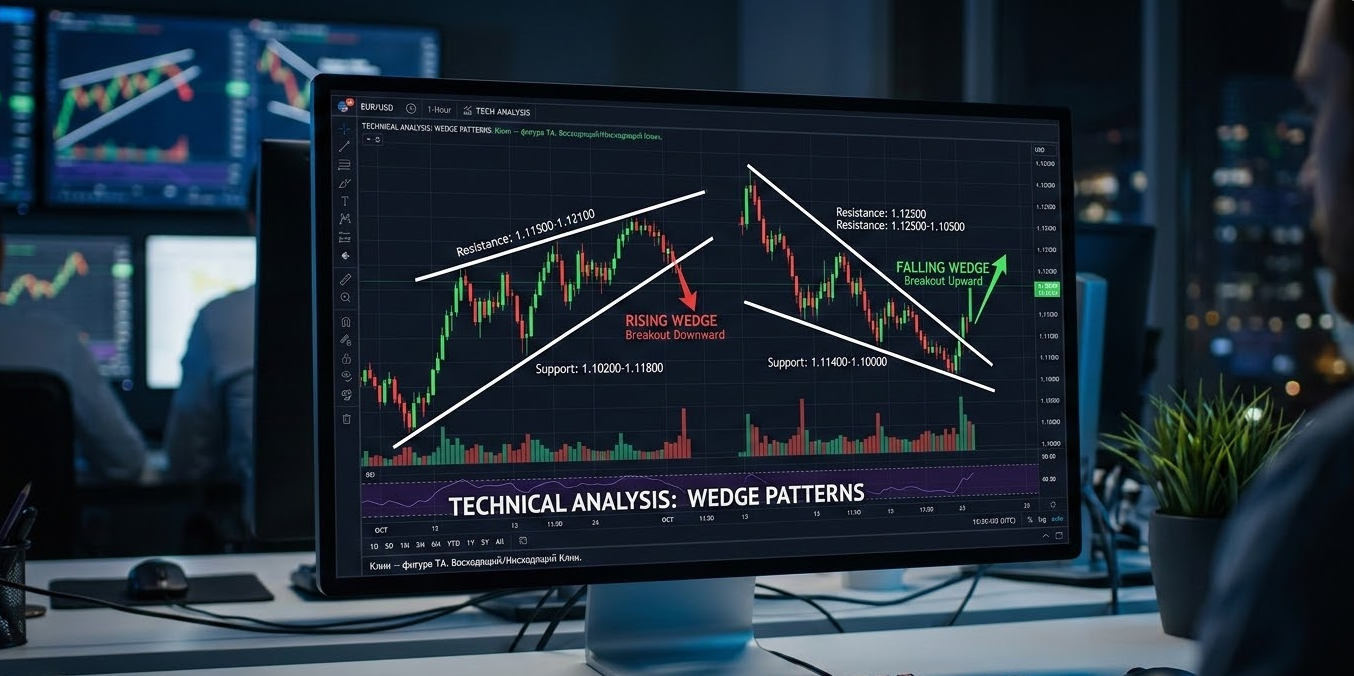
Within the scope of trading, two types of wedge patterns exist – rising and falling – each having a different interpretation:
-
A rising wedge is an upward-sloping trend that occurs when the price's lows continue to fall while the lower support line continues to move higher, causing the price structure to become constricted from the bottom to the top of the price movement; therefore, the angle and direction of both trendlines create the classification of what type of wedge pattern (rising versus falling) you will see on a price chart.
-
A falling wedge usually provides the trader an indication of a potential price reversal or upward price movement. The falling wedge is not simply a chart formation; it is a key indicator that seller volume (supply) is decreasing and therefore, the price will be reversing soon.
As confirmed by classical technical analysis, falling wedges are frequently precursors for the beginning of a bullish trend in the marketplace.
Use of the Wedge Pattern Relative to Market Context
Along with using the wedge pattern, it is important to consider the context of the marketplace. If you do not consider this, your forecast of the market may provide little or no value; thus by using the wedge along with the market context, you will develop a better understanding of what you can expect to happen next in the cryptocurrency market price chart.
Wedges are one of the few patterns on a chart that properly define timeframes, trends, and volume, which allows traders to anticipate price action within an upcoming period or trend. Movement into and out of a wedge shape indicates a change of trend. Falling wedges are considered to be the best indicator for bullish reversal patterns; they display decreased seller activity (and restrictively low buyer activity) before transitioning to a bullish trend.
The Role of Artificial Intelligence
These boundaries are used to help streamline the decision-making process so it doesn't become excessive and overly volatile (due to emotional bias) when managing capital. AI has demonstrated that the identification of wedges is extremely accurate when utilizing specialized indicators combined with on-chain data; increasing the quality of entries by several times and helping avoid the influx of false signals.
Wedges, or falling wedges, are one of the most recognizable and reliable indicators of a potential bullish reversal in the stock market (traditional and crypto).
Wedge Parameters & Ranges
Statistically-defined ranges allow an objective way to identify bullish reversals by identifying wedges; the ASCN.AI studies demonstrate this with successful case studies such as the flash crash.
| Parameters or Patterns | Optimal Value Range (by each key parameter) |
| Wedge: | 34 - 126 |
| Pattern: | 25 - 161 |
| Trend: | 21 - 199 |
| Price: | 18 - 129 |
| Lines: | 14 - 83 |
| Falling: | 13 - 79 |
| Rising: | 9 - 39 |
| Chart: | 8 - 96 |
| Figure: | 8 - 64 |
| Cryptos: | 8 - 88 |
Properties of Patterns
Support/resistance lines are the most important components in the formation of a wedge. In a falling wedge formation, the upper trendline restrains price increases and aligns with local peak prices, whereas the bottom trendline, which is increasing at a steeper slope than the upper trendline, provides support and aligns with local low prices.
The contraction of these two trendlines makes the breakout more significant and often defines the primary direction of a substantial price movement following the breakout. The extremely volatile crypto market showcases these examples easily. Graphically, the support and resistance trendlines will define a triangle formation so that when they are broken out of, a decisive price movement occurs.
-
Uptrend — the successive formation of higher high and higher low price points indicates a strong price movement.
-
Downtrend — the successive formation of lower high and lower low price points indicates that sellers are dominating.
A defining portion of the falling wedge is that the falling support line is developing in an overall declining price environment illustrating that the bears are losing power and that efforts to reverse to the upward movement towards the red line have likely started.
Indications of the Wedge Pattern:
-
Narrowing price ranges between converging trendlines.
-
Price being made lower than the previous price (lower low) at the same time as the general price trend is downward.
-
Trading volume decreasing during the gathering of the wedge pattern.
-
Multiple touches along the trendlines confirming the wedge pattern validity.
In order to confirm the pattern formation accurately, volume behavior and quantity of touches along the trendline edges must be examined - if these supporting elements are missing then the signal will be weak. I suggest using various timeframes and applying other indicators to further enhance the identification of support and resistance levels to reduce the likelihood of mis-entering.
Trading the Falling Wedge Breakout
Trading a falling wedge breakout would consist of entering the trade when the price breaks out of the falling wedge by going above the upper resistance line of the falling wedge. The easiest way to determine that you have broken out is to have confirmation of the breakout first before entering into a trade.
After the price leaves the falling wedge to the upside, you should then look for several forms of confirmation to determine that a genuine and solid breakout is occurring.
Identifying a Genuine Breakout:
-
Increased volume - More traders will be entering the market and that implies that the larger players are also going to be participating in the breakout.
-
Bullish candles - If the price closes above the resistance area, it indicates strength in the breakout.
-
Indicators - If you use indicators, such as the RSI or the MACD, the strength of the breakout will also be supported by momentum.
-
Price Movement - Is the price moving outside of the consolidation range? If the price is moving outside the range, it would likely suggest the breakout will continue in that direction.
In the past, a significant number of incorrect entries occurred because they traded the upper resistance line after confirming that the breakout had occurred; this is the main reason for the majority of false breakouts leading to a loss of funds after executing a trade on the upper resistance line. Additionally, volume and candles can also be used to identify a true trend continuation; however both volume and candles are the two most important elements that have shown an increase in quality of entry.
Indicators for Entry/Exit Points:
-
Volume - If volume has increased, this is an indication that either the banks, institutions, or other large entities have purchased/sold into the market.
-
Relative Strength Index - When the RSI moves from below 50 to above 50, it indicates momentum as bullish.
-
Moving Averages - The longer the price is below the moving average, the stronger the trend.
-
MACD - Divergences and histogram color changes are indications of potential reversal or continuation of the direction of the price movement. When the RSI is above 50 and the MACD shows divergence, the probability of growth is higher.
Risks and Position Management
-
False Breakouts: The risk associated with false breakouts when price quickly returns back into the wedge shape is common in breakout trading and can create losses.
-
Stop-Loss: The stop-loss should be placed slightly below the last local high of the wedge or support line to minimize potential losses.
-
Position Size: Must be chosen using volatility and the dollar amount of your overall capital being used on the trade to limit the risk of losing excess capital.
-
Mitigation: Monitoring stop-loss levels and volume will significantly reduce the likelihood that you will miss out on a good trade due to a false signal.
"Discipline and Accuracy are imperative to be successful in breakout trading."
"Our ASCN trading assistant saves you valuable time and helps to minimize any unnecessary risk."
When trading in the crypto markets, especially with high volatility and multiple false signals, it is advisable to utilize AI tools for filtering and confirming the signals you want to trade off of.
Frequently Asked Questions
Can you trade the falling wedge pattern on all timeframes?
Yes, you may. The falling wedge pattern can be identified on any timeframe (minutes to days or greater). However, longer time periods (4 hour or daily) will produce more reliable signals since the longer-time periods remove the random market noise associated with shorter time periods.
What are the differences between True Breakouts and False Breakouts?
Look to see if the breakout has a significant increase in volume and confirmation based on candlesticks. The volume associated with a true breakout will typically be significantly larger than would be seen on a false breakout.
Can you effectively trade the falling wedge in the 24x7 Crypto Market?
Yes, however, risk management should be strictly adhered to, and you should remain current with news that will affect the volatility of the asset.
Conclusions and Recommendations for Traders
The falling wedge pattern is a very strong technical analysis indicator that points to the potential for a change from bearish to bullish, depending on volume and other indicators you confirm the breakout with. To successfully work with this tool, you must be able to read the falling wedge pattern and track the trends of both the support and resistance lines as well as confirm the breakout using volume and other indicators.
To increase your success when trading, consider using modern tools and AI data along with a traditional wedge analysis system. An example of such a modern tool would be ASCN.AI, which provides an opportunity to capture your signals in a timely manner, make anticipated decisions ahead of time, and reduce your emotional exposure to risk.
Disclaimer
This article is for informational purposes only. There are no guarantees that you will be successful by following any of the examples or guideline provided here. The information you receive in this article should never serve as a replacement to a fully qualified consultation by a trained financial advisor. Trading in financial markets is a highly speculative activity, and there is no guarantee that past performance will be reflected in your future results.