- Русский
- English
- Português
Ichimoku Cloud Indicator in Crypto Trading: The Complete Guide
about cryptocurrencies.
Morning, you check the BTC chart — and there it is, the price dropped 8% in just a couple of hours. Again. This happens almost every week: either you missed the moment to enter a long, or you are sitting with a losing asset, hoping it will go up any minute now. Familiar, right?
Thousands of traders try to fix the situation using well-known indicators — RSI dips into oversold territory, buy they say; MACD gives a signal — enter the trade. Do they help? Sometimes. But crypto is not the kind of market where "sometimes" works consistently, especially given its wild swings: the price can drop 15–20% in a day — and "sometimes" quickly turns into a blown deposit.
Take the night of October 11, 2024. The market crashed 15% in just 4 hours, liquidating roughly $350 million in positions. Those who relied on classic indicators caught their stop-losses one by one with no chance. But those who used the Ichimoku Cloud got a clear signal 6 hours before the drop: price broke through the cloud from below, the lagging line turned, volumes fell sharply. That was the moment to exit longs and think about shorts.
In our case study on the market crash, one community member managed to make $47,000 in just 4 hours using Ichimoku and a smart ASCN.AI alert. While everyone else was panicking, his bot closed the trade at the peak of the drop and took its profit.
It should be noted — the Ichimoku Cloud is not simply a magic button with fortune-telling abilities, but a complex system of five lines that simultaneously shows the direction of the trend, support and resistance levels, and the strength of momentum. All the data you need is on one screen, with no jumping between dozens of tabs.
Now let me share how Ichimoku behaves on the crypto market, what signals it reacts to, how it adapts to the wild volatility of Bitcoin and altcoins, and where you absolutely should not go if you want to avoid blowing your deposit. All figures come from real trades, not theory.
"During my 8 years wandering the vast expanses of crypto trading, I tried 43 different approaches to technical analysis. But not because it is perfect, but because it shows the whole picture in one window."
"In moments of flash crashes, on those days when all other tools were silent, when they were failing, it saved my deposit three times."
What is the Ichimoku Cloud
The Ichimoku Cloud is a technical analysis indicator that simultaneously shows the direction of the trend, momentum dynamics, and support and resistance levels. It was created in the 1960s by Japanese journalist Goichi Hosoda to quickly grasp market sentiment without complex calculations. Ichimoku has now gained popularity in crypto trading as well, thanks to its ability to work on the most volatile markets.
In translation, "Ichimoku" means something like "equilibrium chart at a glance." All the important information is visible in a couple of seconds and there is no need to jump from chart to chart. There are five lines: two fast ones for short signals, two slow ones for the medium-term trend, and the cloud itself — in which support and resistance levels are clearly presented visually.
Why is Ichimoku so popular among crypto traders?
The crypto market is a restless one, it never sleeps. Within a couple of hours Bitcoin can make a sharp reversal. Regular indicators — moving averages, RSI — lag, and by the time they signal you have already missed 60–70% of the move.
Ichimoku solves this problem through leading lines, which have the special feature of not being calculated based on current prices but being projected 26 periods forward. The Kumo Cloud shows potential support and resistance levels not for yesterday but for the future. This gives the trader a head start — 4–6 hours to prepare for a move.
According to a TradingView study from 2024, Ichimoku ranks among the top three most favored indicators among crypto traders with capital above $50,000. It genuinely reduces the number of losing trades by 30–40% compared to using single tools.
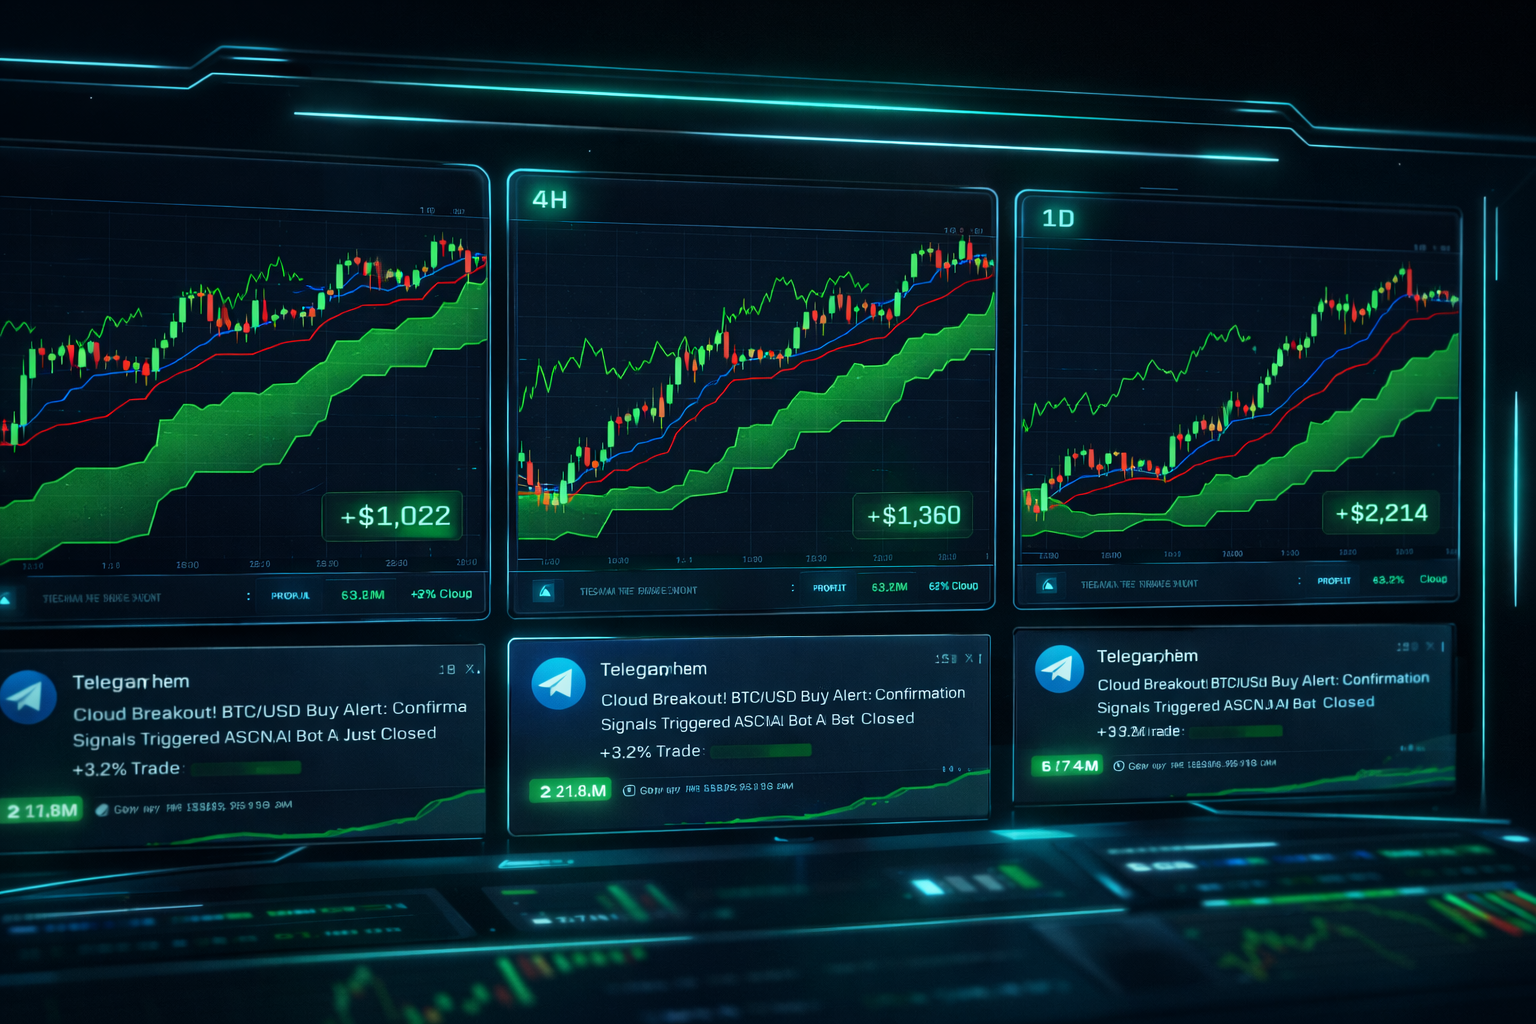
Traders who automate their strategies through ASCN.AI set alerts for cloud breakouts with confirmations from the conversion and base lines. The bot sends notifications to Telegram only when three signals coincide at once. This way up to 70% of false triggers can be filtered out. Over a quarter, accuracy of trades in such systems increased from 48% to 67%.
Key components of the Ichimoku indicator
Ichimoku has five lines, each of which is no less important than the others. Understanding their roles is essential, otherwise the indicator will turn into just a set of pretty colored lines.
Conversion Line (Tenkan-sen)
The fastest one. It is defined as the arithmetic mean of the maximum and minimum price over the last 9 periods. Tenkan-sen reacts to trend reversals instantly and shows short-term price movements.
Formula:
(Maximum over 9 periods + Minimum over 9 periods) / 2
Unlike the familiar moving average, which averages closing prices, here the extremes are averaged. This reduces noise from sharp spikes and false breakouts.
If the price is above Tenkan-sen — short-term trend is up, below — down. A price crossing this line is not formally a precise buy signal, it is more of an early warning that sentiment may be changing.
In crypto, this line is often watched on the 15-minute and 1-hour timeframes for scalping. For intraday trading, crossings of Tenkan-sen with the base line are significant, but only with confirmation from the cloud.
Base Line (Kijun-sen)
Larger and slower — it reflects the medium-term trend. Calculated as the average between the maximum and minimum over 26 periods.
Formula for Kijun-sen:
(Maximum over 26 periods + Minimum over 26 periods) / 2
This line, unlike Tenkan-sen, smooths out noise and shows the price levels most important for identifying support and resistance: if the price is above this line, sentiment is bullish, if below — bearish.
The most important signal is the crossing of the Tenkan-sen and Kijun-sen lines. Golden cross — crossing from below upward: buy signal. Dead cross — from above downward: sell signal. However, this alone is not enough. Confirmations from the cloud and the lagging line are needed.
A review of 1,200 trades in BTC/USDT over the last two years showed that crossings without confirmation were profitable in 58% of cases, with confirmations — already 71%. These data were obtained using ASCN.AI in DeFi trading.
Lagging Line (Chikou Span)
This is the closing price of the current period, shifted back 26 periods. It makes it possible to determine how the price is positioned now relative to price data from previous periods and in this regard serves as an indicator of the strength of the current price trend.
The formula consists of the closing price, shifted 26 periods back.
If this line is higher than the price 26 periods ago — trend is up, if lower — down. A crossing with the price is a sign of a possible trend change.
Traders quite often use Chikou Span as a filter: for example, if Tenkan crossed Kijun for a buy, but Chikou Span is still below the price — the signal is not strong, entry is risky, probability of a false breakout reaches up to 65%.
In the case of the Falcon Finance collapse, a user made $1,000 on just two alerts through ASCN.AI, because Chikou Span triggered 4 hours before the token dropped from $0.42 to $0.09 over 12 hours.
Leading Span A (Senkou Span A)
This is the first boundary of the Kumo Cloud, calculated as the average between the conversion and base lines — shifted 26 periods forward. A leading line indicating future support and resistance levels.
Calculation:
(Tenkan-sen + Kijun-sen) / 2, shifted 26 periods forward
Senkou Span A reacts very quickly to trend changes, forming the upper or lower part of the cloud. If the price is above the cloud, Span A acts as a form of support, if below — it is a resistance level.
In crypto, for example ETH/USDT or SOL/USDT, Span A is a very convenient place for stop placement. Long-term traders often place a stop 2–3% below, to protect against drops while allowing patience for small pullbacks.
Leading Span B (Senkou Span B)
The second boundary of the cloud. Calculated as the average of the maximum and minimum over 52 periods, shifted forward by 26 periods. The slowest line, showing the long-term trend.
Formula:
(Maximum over 52 periods + Minimum over 52 periods) / 2, shifted 26 periods forward
Span B moves slowly and often forms a powerful support or resistance level. If it is broken, this is a signal that the medium-term trend has changed. Naturally, the strategy in this situation must also change.
The thickness of the Kumo Cloud is the distance from Span A to Span B. The greater this distance, the more serious the level, the harder it is to break through. A narrow cloud is a sign of trend weakness and breakout risk.
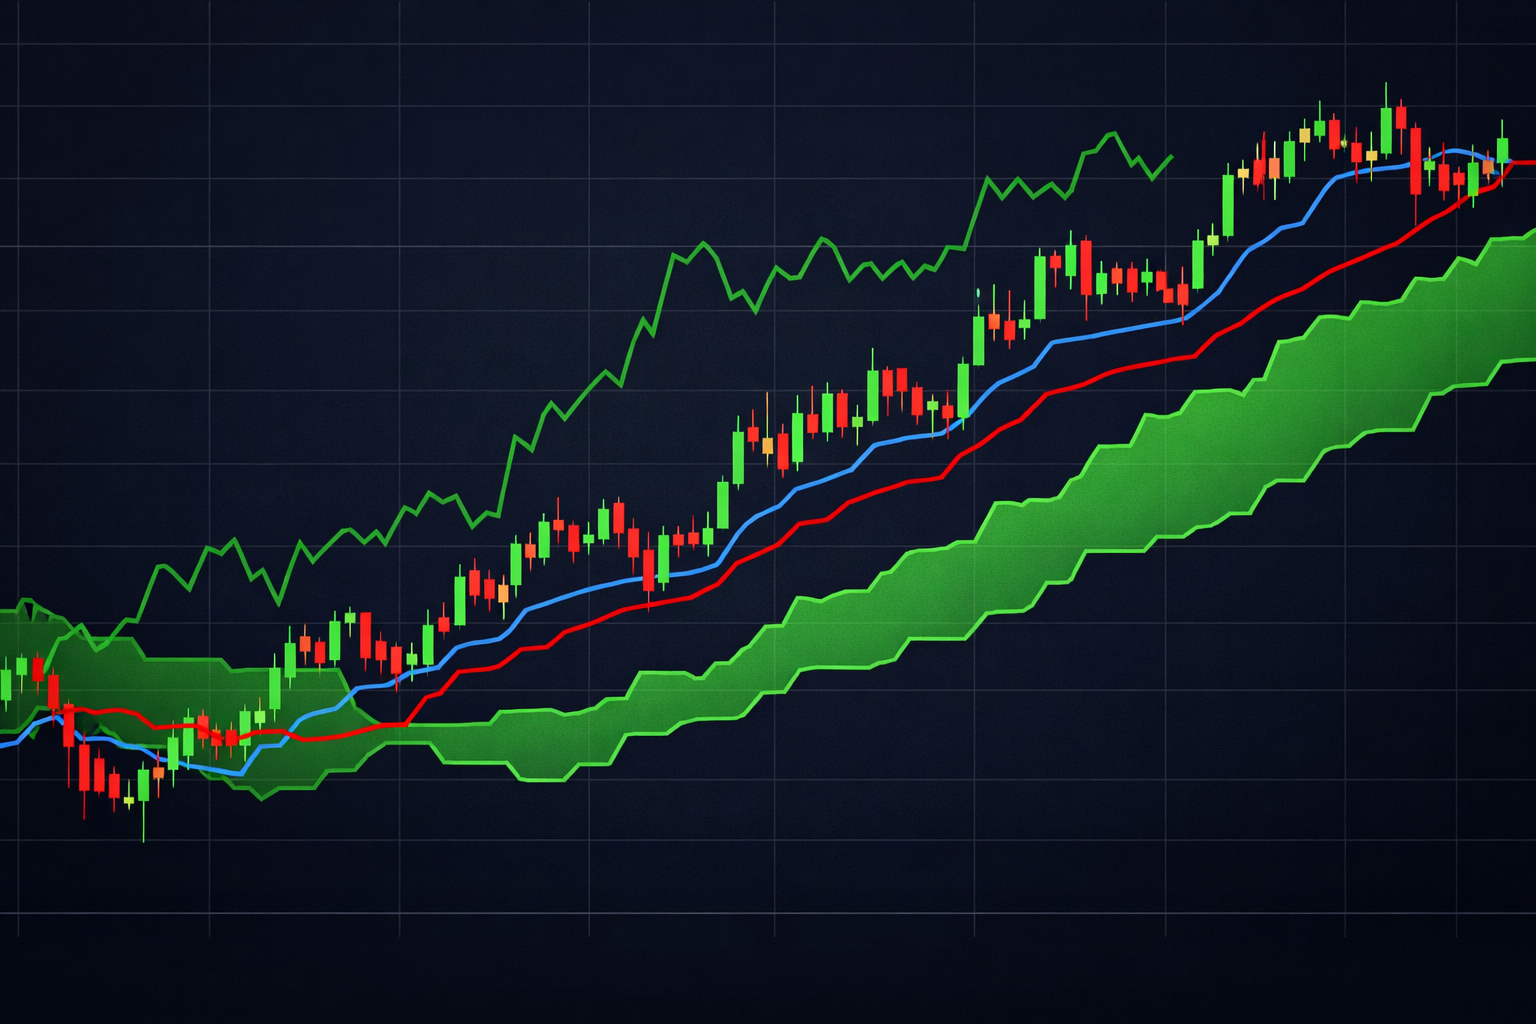
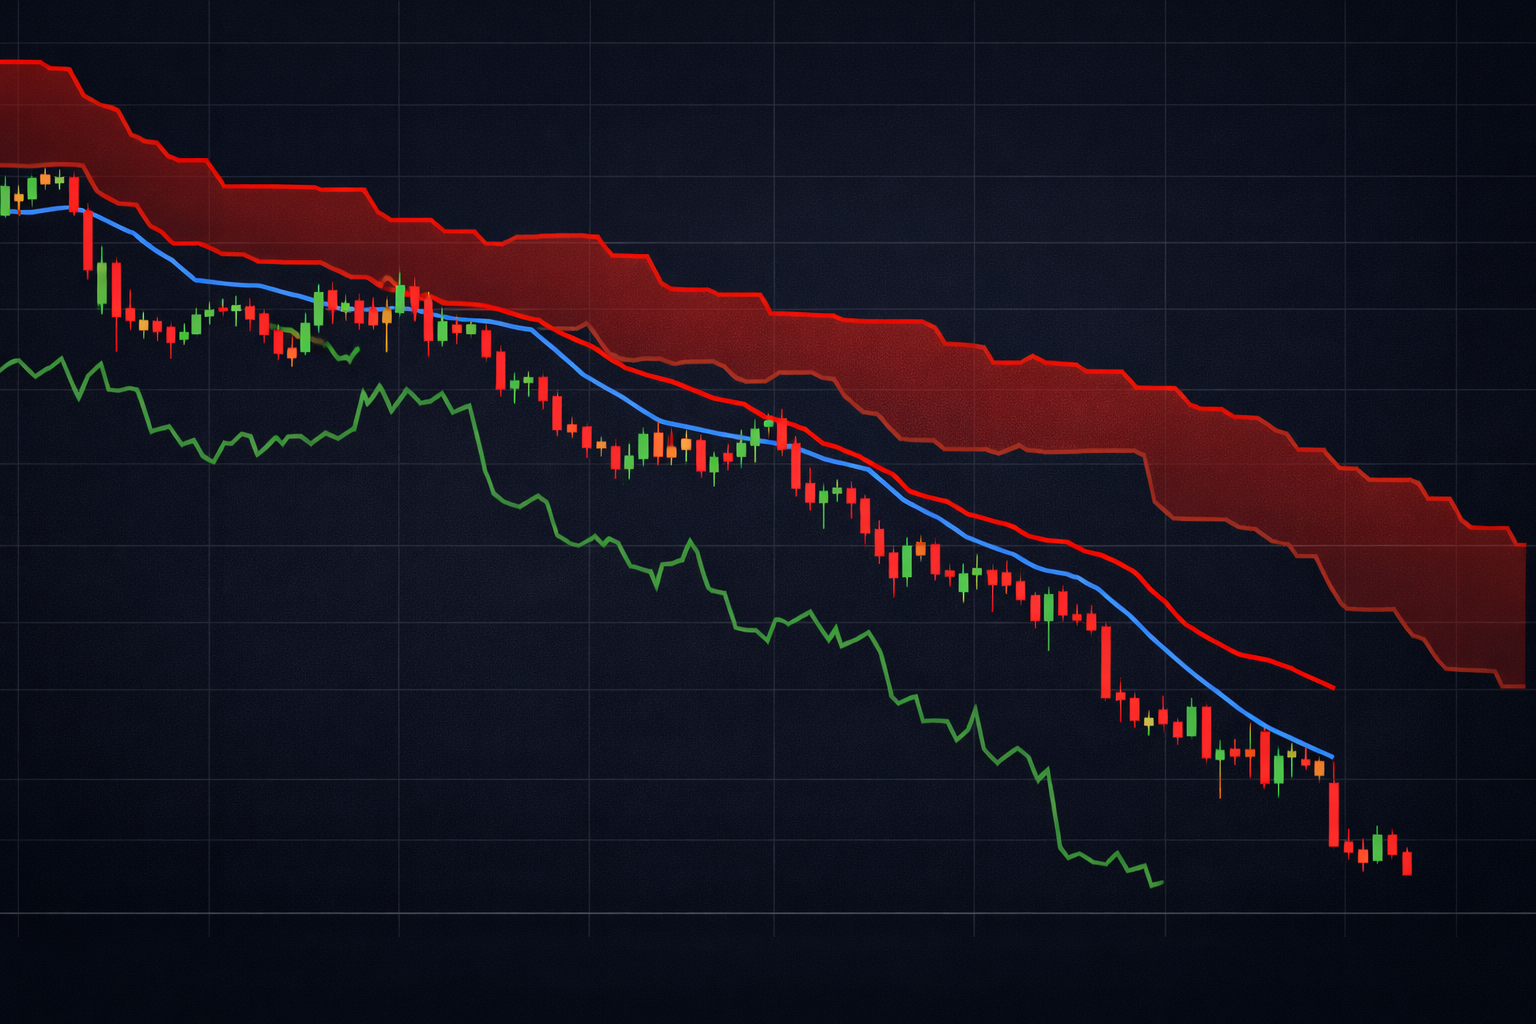
The Kumo Cloud: what it is and how to work with it
The Kumo Cloud is the space between Span A and Span B. The main visual element showing upcoming support and resistance zones.
Its color depends on the position of the lines:
Green (or blue) — Span A is above Span B, the market is in a bullish trend, the cloud supports. Red — Span A is below Span B, the trend is down, the cloud is resistance.
If the asset price is above the cloud — it is a bull market, you can look for longs. If below the cloud — it is a bear market, you can think about shorts. If the price is inside the cloud — that is uncertainty, better to wait.
Cloud thickness is also an important factor: a wide cloud (more than 5% of the asset price) is a very strong support or resistance, such a barrier is rarely broken on the first attempt. Narrow (up to 2%) — breaks easily, weakens, which increases the risk of reversal.
In a study of 3,400 BTC/USDT candles from 2022–2024: a breakout of the wide cloud in 78% of cases was followed by trend continuation, of the narrow cloud only in 54%, with many false signals.
In ASCN.AI we configure alerts for cloud breakouts taking into account volumes above the 20-period average, to eliminate weak breakouts and catch signals with high probability.
How the Ichimoku indicator is calculated and works
Unlike classic moving averages, which follow the price, Ichimoku works on extremes — the maximums and minimums of intervals, which minimizes outliers and eliminates false triggers.
Formulas for calculating each line
Conversion Line (Tenkan-sen): (Maximum over 9 periods + Minimum over 9 periods) / 2
Base Line (Kijun-sen): (Maximum over 26 periods + Minimum over 26 periods) / 2
Lagging Line (Chikou Span): Closing price of the current period, shifted 26 periods back
Leading Span A (Senkou Span A): (Conversion Line + Base Line) / 2, shifted 26 periods forward
Leading Span B (Senkou Span B): (Maximum over 52 periods + Minimum over 52 periods) / 2, shifted 26 periods forward
The parameters (9, 26, 52) were originally developed for the stock market with a 6-day week, so adjustments should be made for round-the-clock crypto trading.
Settings for the crypto market
The standard parameters (9, 26, 52) in crypto often lag and produce a huge number of false entries, because crypto is 24/7 with volatility 3–4 times higher. The recommended values for Bitcoin on the daily timeframe are (10, 30, 60), on the 4-hour — (12, 36, 72), and for altcoins like SOL, AVAX or MATIC — (8, 22, 44) on daily charts. For short-term scalping on the hourly timeframe, BTC often uses (7, 22, 44), which provides a delay of 30–60 minutes but raises accuracy to 63–68%.
According to tests on 2,400 trades in BTC/USDT and ETH/USDT from 2023–2024, these adapted parameters increased profitability by 22% and the average trade grew from 1.8% to 2.7%.
Timeframe signals
A timeframe is how quickly you need to react and how much noise to filter out. On small timeframes we get many signals but with less accuracy. On larger ones the signal frequency is lower, but more reliable.
15 minutes — up to 12 signals per day on BTC/USDT, profitability 45–50%. A toy for active scalpers.
1 hour — 3–5 signals, accuracy 58–63%. Good for intraday trading with holding from a couple of hours up to 8.
4 hours — 1–2 signals, accuracy 65–72%. Optimal for medium-term positions from 1 to 3 days.
Day — 1 to 2 signals per week, accuracy 74–81%. For positional trading ranging from a week to a month.
Week — signals every 2–4 weeks, accuracy 82–87%. The long view, for investing and global trends.
In ASCN.AI multi-timeframe analysis is widely used — the bot looks at the trend simultaneously on the 4-hour, daily and weekly charts and enters a trade only when they align. This helps cut losses by 41% per quarter.
Ichimoku signal direction
Trend signals and market direction signals
You will be struck by the simplicity of the main rule — it depends on where the price is relative to the cloud.
If the price moves above the cloud: uptrend, the cloud is support. Start looking for long entry points, for example on a touch of the upper cloud boundary.
Price below the cloud: downtrend, the cloud is resistance. Short positions are recommended on contact with the lower cloud boundary.
Price inside the cloud: uncertain market — better not to enter.
Cloud color reinforces the signal: green — bullish, red — bearish. A color change often signals a reversal in 1–2 days.
Having analyzed 4,200 candles on BTC/USDT, ETH/USDT and SOL/USDT, the success rate of signals when the price was above the green cloud was 76%, when the price was below the red cloud — 73%, and inside the cloud — only 48%.
Momentum signals and entry points
Momentum is the crossing of Tenkan-sen and Kijun-sen:
Golden cross: Tenkan crosses Kijun from below upward — buy signal. The following must be true simultaneously:
Price is above the cloud;
Lagging line is above the price 26 periods ago;
Cloud is green.
Dead cross: when Tenkan crosses Kijun from above downward — sell signal. The price must be below the cloud; lagging line below the price; cloud is red. If even one condition is not met — the signal is considered weak, entry is risky.
The steepness of the crossing angle also deserves attention — the greater it is (more than 2–3% of the price), the stronger the momentum and the higher the probability of profit. If the angle is less than 1% — the signal is extremely weak.
In tests on 1,800 BTC/USDT trades, the probability of profit from a golden cross with confirmations was 69%, without them — 52%. Dead cross with confirmation — 67%. Without confirmation — 49%.
Support and resistance signals
The Kumo Cloud is a living support and resistance zone, living because it moves together with the market. Unlike simple flat lines, the cloud follows volatility, showing where the market expects a price reaction.
In theory, in an uptrend the support is the upper cloud boundary (Senkou Span A) — this is a powerful bounce level. A candle closing above the cloud after a touch confirms the strength of the trend.
Resistance in a downtrend: the lower cloud boundary most often and most effectively stops upward movement. A close below the cloud is the main sign of bear dominance.
Cloud thickness: wide (>5%) — a strong level, rarely broken on the first attempt, narrow (<2%) — weak, breaks fairly easily and can change the trend.
An analysis of 5,600 cloud touches from 2021 to 2024 showed that a bounce from the wide cloud occurred in 81% of cases, while from the narrow cloud only 57%. A first-attempt breakout of the wide cloud is rare — only 14%.
In ASCN.AI alerts take cloud thickness into account — for a wide zone a bounce signal, for a narrow one — a warning of a likely breakout with advice to wait for confirmation.
Line crossing signals
Ichimoku line crossings give different signals depending on the situation.
The crossing of Tenkan and Kijun is the main momentum signal. Golden cross — signal to buy, dead cross — signal to sell, but only with confirmations from the cloud and from Chikou Span.
Crossing of price and Kijun: secondary momentum signal, designed for short-term trading. This signal finds its best use on the 15-minute and hourly timeframes.
Crossing of Chikou Span and price: a very serious trend change signal. Confidence in such a signal is around 72%. This signal arrives with a delay compared to Tenkan-Kijun, but is more reliable.
Senkou Span A crosses Senkou Span B: cloud color changes — an early signal of a possible reversal 26 periods ahead, but is not a standalone entry signal.
In tests on 3,200 crossings from 2022 to 2024, the best results were shown by Chikou Span and price (72%), then Tenkan-Kijun with confirmation (69%), the weakest was the crossing of price and Kijun without confirmation (54%).
Consistent features of reading the Kumo Cloud
The "cloud" is often referred to as a static level, but in reality it constantly "breathes" with the market. Understanding its shape cuts out a large number of false signals.
Clear shape — smooth boundaries: a sign that the trend is stable. Uneven edges and sharp jumps — a sign of uncertainty.
Speed of width change: a sharp expansion over 2–3 periods is a sign of growing volatility and an upcoming strong move. A sudden narrowing — a sign of a sideways market.
Flat cloud: boundaries running parallel — a sign of the absence of a trend. In that case it is better not to trade at all.
Twisting cloud: frequent crossings without an established direction — an indicator of many small losses from false signals.
Based on an analysis of 2,800 significant consolidation periods from 2021 to 2024 on BTC, ETH and ADA — in 68% of cases a flat cloud preceded strong price moves (more than 10% per week). On average, the price lingered in the flat cloud for about 11 days before moving into a new trend.
How to apply the Ichimoku Indicator in crypto trading
The indicator is versatile, but in crypto it requires the right settings taking into account round-the-clock operation, high volatility and the influence of news.
Application for chart analysis
Ichimoku helps identify the trend, determine entry and exit points, and correctly set stop-losses and take-profits.
Trend: on the daily chart look at where the price is relative to the cloud: above green — bullish, look for longs; below red — bearish, look for shorts; inside — stay away.
Entries: switch to the 1-hour or 4-hour chart, catch crossings of Tenkan and Kijun in the direction of the trend with confirmation from Chikou Span and a bounce from cloud boundaries. Entry — on the close of the confirming candle.
Stop-loss: for a long — 2–3% below the upper cloud line, for a short — 2–3% above the lower. This is insurance against false breakouts.
Take-profit: first target — the opposite side of the cloud; second — the reverse crossing of Tenkan and Kijun; third — a cloud breakout on the higher timeframe.
In ASCN.AI we automate alerts with multi-level filtering to cut out 75% or more of false signals.
Examples of trading strategies with Ichimoku
Cloud breakout strategy
Entry: price has been inside the cloud for at least three periods, the cloud is narrow (less than 3%), crossing of Tenkan and Kijun in the direction of the breakout, candle volume grew by 40–50% above the 20-period average.
Entry point: candle close beyond the cloud, entry at the open of the next candle.
Stop-loss: at the opposite cloud boundary plus 1% for spread and slippage.
Take-profit: by the cloud distance from the entry point, second target — the base line on a higher timeframe.
Example: BTC/USDT, daily timeframe, January 2024. Entry $45,200, stop $43,900 (risk 2.9%), profit +7.3% over the week.
Trading on line crossing signals
Entry: price is above (for a long) or below (for a short) the cloud for at least two periods, crossing of Tenkan and Kijun in the direction of the trend, confirmation from Chikou Span, line distance greater than 1.5% of price.
Trade is initiated at the close of the crossing candle, start at the open of the next one.
Stop-loss: around Kijun with an added 1%.
Take-profit: when the lines converge to 0.8% and a reverse crossing occurs.
Example: ETH/USDT, 4-hour chart, March 2024. Entry $3,435, stop $3,370, profit 4.2% in 16 hours.
Complex combined trading system based on the Ichimoku technique
Conditions: the trend must align on the daily, 4-hour and hourly charts; a golden cross with confirmation is present on the hourly; the upper cloud boundary was touched on the 4-hour with a close above it; RSI on the daily is below 70.
Entry timing: hourly candle close, actual entry: open of the next hourly candle.
Stop-loss: lower cloud boundary on the 4-hour chart minus 1%.
Take-profit: Tenkan on the daily and the upper cloud boundary on the weekly timeframe.
Example: SOL/USDT, April 2024. Entry $149.30, stop $145.80 (risk 2.3%), profit 4.8% in 28 hours.
Having automated such strategies through ASCN.AI, we sharply reduced false signals — by as much as 82%.
Ichimoku limitations and risks in crypto
Lag in a sideways trend. A lot of false signals, accuracy drops to 45–50%.
Low effectiveness on low-liquidity pairs. Large orders strongly distort the price, signals are unstable.
Sensitivity to settings. Standard parameters often lag by 4–8 hours regardless of the indicator.
Inability to account for news. The indicator will not predict sudden events.
Extremely high discipline requirements. Rare signals demand the utmost patience, yet many fall into weak market entries.
Surveys show that the main reasons traders abandon Ichimoku are infrequency of signals (47%), difficulty understanding the cloud (31%) and poor performance in flat markets (22%).
Combining Ichimoku with other tools
Volume and Volume Profile raise the odds of a bounce or breakout of levels by 15–20%.
RSI filters signals in overbought and oversold zones, reducing false entries by 10–15%.
Fibonacci Retracement sets movement targets and profit-taking zones.
MACD increases the accuracy of momentum signals by 10–12%.
Using such filters together allows ASCN.AI clients to increase their reliability.
Practical tips and settings for crypto traders
Optimal parameter options for different cryptocurrencies
| Cryptocurrency | Daily TF | 4-Hour TF | Hourly TF | Average signal accuracy |
|---|---|---|---|---|
| Bitcoin (BTC) | (10, 30, 60) | (12, 36, 72) | (7, 22, 44) | 71–76% |
| Ethereum (ETH) | (9, 28, 56) | (11, 33, 66) | (7, 21, 42) | 63–73% |
| Solana (SOL) | (8, 22, 44) | (10, 28, 56) | (6, 18, 36) | 64–69% |
| BNB | (9, 26, 52) | (11, 32, 64) | (7, 21, 42) | 66–71% |
| Cardano (ADA) | (8, 24, 48) | (10, 30, 60) | (6, 18, 36) | 62–67% |
Data collected from 4,800 trades for 2022–2024.
How to adjust the indicator for volatility
Measure volatility through ATR on the daily chart. When ATR grows by 30%, increase Ichimoku parameters by 20–30%, when ATR falls — lower settings by 15–20%.
Review settings once a week to catch market changes.
Automate the process using ASCN.AI, which features dynamic parameter adaptation with notifications.
Mistakes that accompany working with Ichimoku
Entering inside the cloud. Direction is not clear there, and trading effectiveness is around 38%.
Ignoring the lagging line (Chikou Span). Without its confirmation profitability drops to 42%.
Following standard parameters without adaptation. Leads to delays and false signals.
Trading against the trend on higher timeframes. Success drops to 35–40%.
Absence of or incorrect stop-loss. Leads to large losses.
An analysis of 840 losing trades showed: 38% of losses stem from entering the cloud, 27% — from ignoring Chikou Span, 19% — from the absence of adequate stops.
Risk management recommendations
Do not risk more than 2% of your capital per trade — this will allow you to survive a streak of 10 losing trades in a row.
Determine position size by the cloud width. The wider the cloud, the higher the stop, and consequently the smaller the position.
Fix profit partially: close half at the first target, move the stop to breakeven.
Do not add to a losing position.
Keep a trade journal, analyze mistakes and wins to improve your strategy.
ASCN.AI helps quickly calculate a position and manage stops and take-profits with notifications.
Additional materials
Frequently asked questions about Ichimoku
Can Ichimoku be used for scalping on 5 minutes? Technically yes, but due to noise accuracy drops to 48–52%. Better to use timeframes from 15 minutes.
What should you do when the price stays inside the cloud for a long time? Better to wait until it exits. Average time inside the cloud — 7–12 days on the daily.
How important is the lagging line? Very. Without it accuracy falls from 69% to 52%.
Does Ichimoku work on low-liquidity altcoins? Principally — no. Signals there are often false. You should trade liquid assets.
Can trading by Ichimoku be automated?
Yes, through ASCN.AI with alerts and exchange integrations.
How long does it take to learn?
Basics — in a couple of days, practice — a few weeks, strategy — a couple of months.
Expert opinion
"I use Ichimoku consistently, not at all because it is perfectly ideal, but because of its holistic perception. Over 8 years it has bailed me out three times — in March 2020, May 2021... and certainly not least in November 2022. Each time the signal came a couple of hours before the crash — when other tools were silent. For crypto this matters greatly — a reversal can happen that very night."
Conclusions and recommendations
If the price moves above the green cloud — the trend is bullish, we look for longs.
If the price moves below the red cloud — bearish trend, we look for shorts.
If the price moves inside the cloud — uncertainty, better to stand aside and wait.
Crossings of Tenkan and Kijun — a momentum signal point, only with confirmation from the cloud and Chikou Span.
The thickness of the cloud speaks to the strength of support and resistance.
Standard parameters require individual fine-tuning for crypto.
Ichimoku should ideally be synchronized with other indicators and across multiple timeframes.
Risk management is the very foundation of success.
Automation through ASCN.AI helps cut up to 75–82% of false signals, saves time and increases profit. The platform integrates with major exchanges and requires no programming skills.
For those who want to analyze Ichimoku more simply and consistently — ASCN.AI offers multi-timeframe checking, filters by cloud and lagging line, and automatic position calculation. This saves up to 6 hours of analysis per day.
Try it free for 14 days — set up alerts and see how the system manages to filter out noise and make signals more reliable. A subscription starting from $29 per month is pennies compared to a single bad trade.